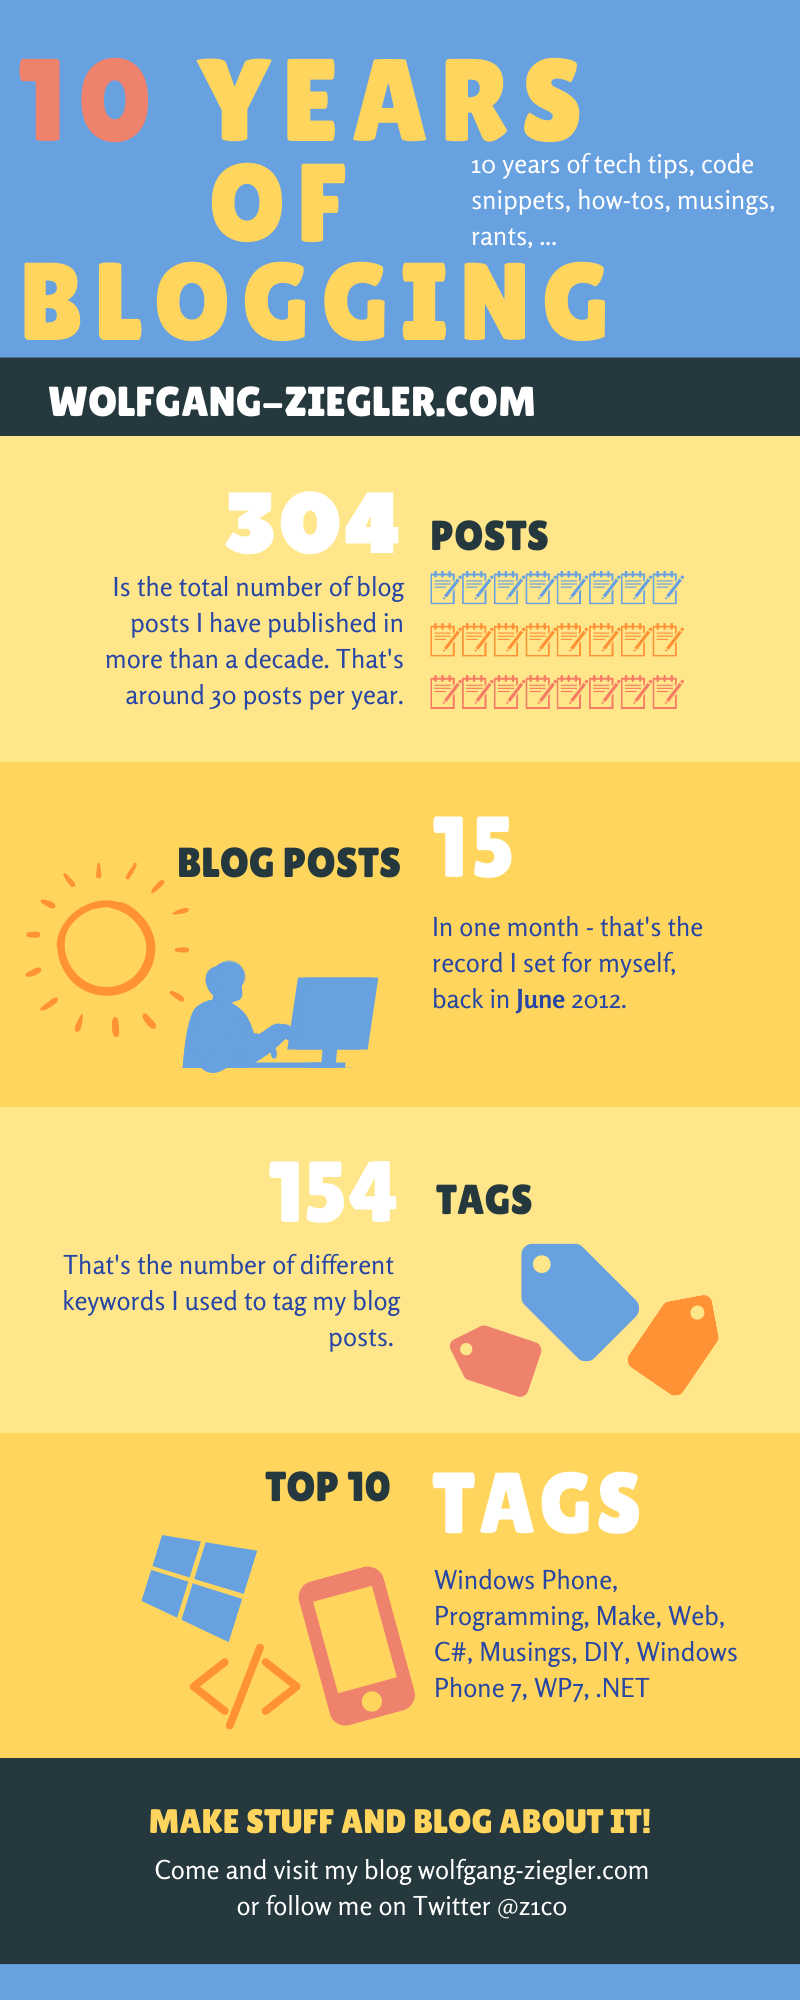
10 Years of Blogging
January 21, 2021Holy cow! It looks like I have been blogging for more than 10 years now. It's time to do a little retrospective.
My First Blog Post
My first blog post from 2007 titled The Guard Pattern meets IDisposable was about a .NET programming design pattern. In retrospect, this fits really nicely since it set the stage for a whole slew of .NET, C# and programming blog posts yet to come.
I remember that I posted this on some hosted blogging platform, which I am pretty sure does not exist any more. Luckily, I still found a local copy of that post later which I had written using Windows Live Writer (now Open Live Writer) so I could re-publish it. This way I managed to unearth a few other posts (one per year from 2007-2010) but most of what I wrote in those 4 years got lost, unfortunately.
However, starting from 2011, all blog posts were either migrated to this current site or published on it.
Let's have a look at a few statistics.
Total Blog Posts
The total number of blog posts I have created so far is 304.
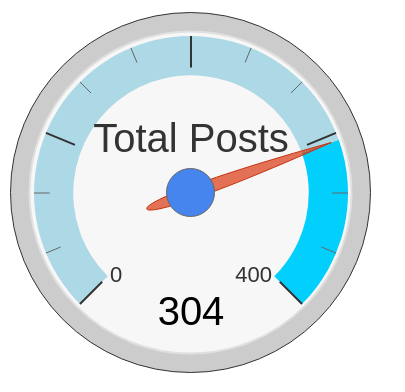
I'm not quite sure what to make of this number, it does not really sound like a lot for more than a decade, but then it comes down to around 30 blog posts pear year which is not terrible either.
Blog Posts per Year
Note: I removed the first 4 posts from the years 2007 - 2010 from the following statistics, since there was only one post in each year.
Let's have a look at how many posts I created in each of those 10 years.
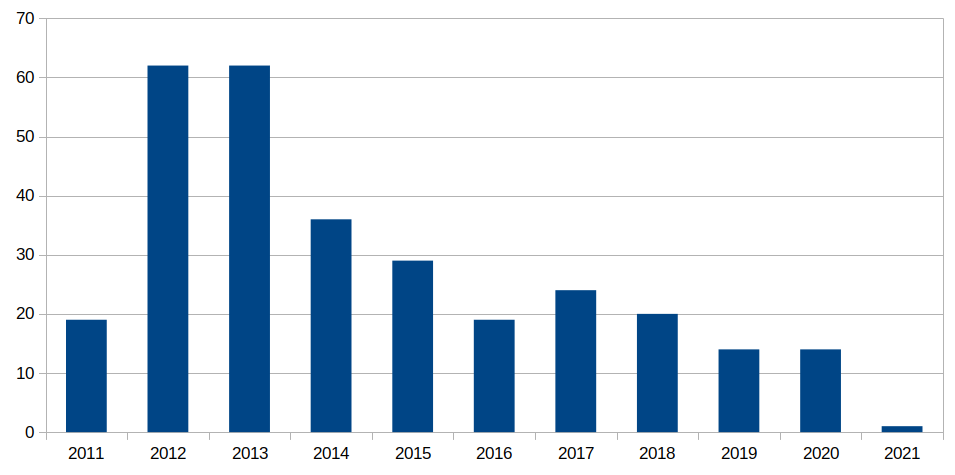
Apparently, in 2012 and 2013 I was really productive with 62 blog posts in both years (nice coincidence). To be honest, this high number also comes down to me being very active in Windows Phone app development at that time. And many of my posts were of the "hey, there's a new app of mine" kind. (e.g this post).
Blog Posts per Month
Another interesting statistic is which months would be my most productive ones in terms of blogging.
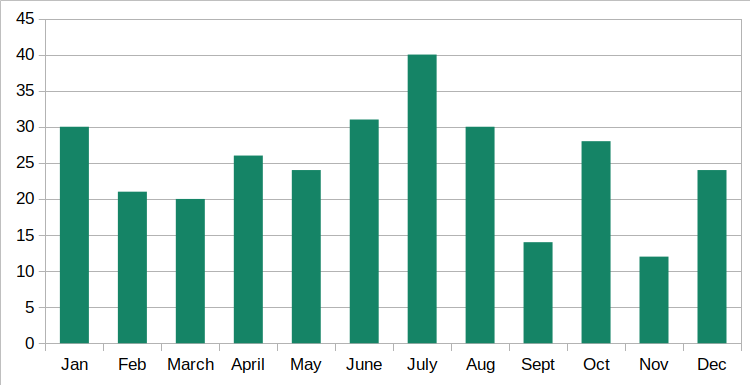
Apparently, on average July is my most productive month when it comes to blogging (this surprised me) and November the least productive one.
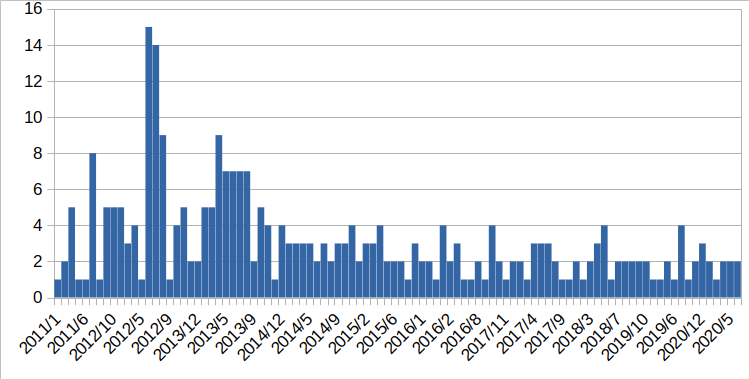
Blog Posts for each Month
So, let's look at the number of blog posts in all individual months since 2011. This shows again the really productive early years (2012 and 2013) where a high amount of blog posts were created around July, which explains the previous chart. Since then, I have settled at around 1-2 posts per month, which is OK but could be better.
Categories (aka Tags)
I counted 154 different tags with which I marked my blog posts.
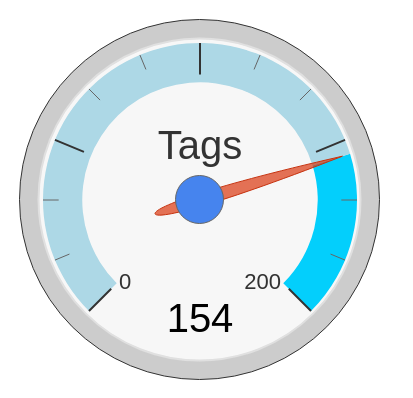
That's quite a variety ...
Let's look at some statistics there.
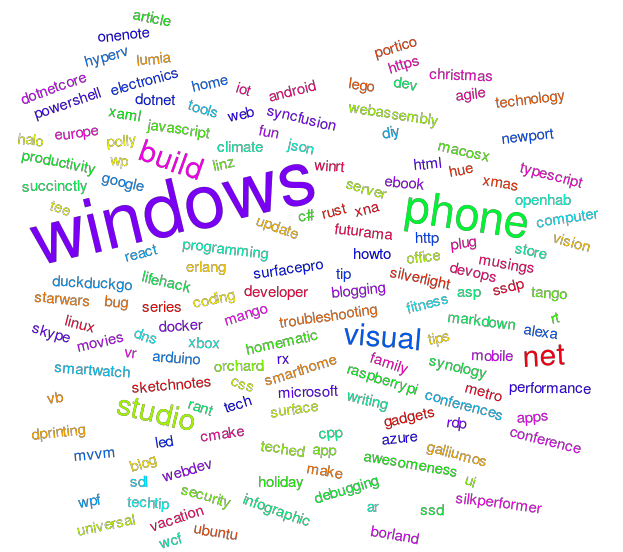
Top 10 Tags
These are the 10 most frequently used tags throughout all my blog posts.
| Tag | Count |
|---|---|
| Windows Phone | 45 |
| Programming | 32 |
| Make | 32 |
| Web | 32 |
| C# | 32 |
| musings | 31 |
| DIY | 28 |
| Windows Phone 7 | 28 |
| WP7 | 28 |
| .NET | 25 |
That's what I more or less expected. Posts about Windows Phone rank first since there was I time I was really passionate about that ecosystem and wrote quite a few apps for it. Windows Phone even makes two more appearances with Windows Phone 7 and WP7 in this top ten list.
Other top-ranked tags cover .NET Programming (C#, .NET) which is my passion to this day.
Also the tags Make and DIY rank high which seems about right, since I remember writing quite a few blog posts describing projects I did.
Let's take a further look, how these top ranked tags developed over time.
Top 3 Tags 2011
Little surprise there.
| Tag | Count |
|---|---|
| .NET | 10 |
| WP7 | 9 |
| C# | 9 |
Top 3 Tags 2012
A very similar picture to the year before.
| Tag | Count |
|---|---|
| Windows Phone 7 | 18 |
| WP7 | 17 |
| C# | 14 |
Top 3 Tags 2013
Apparently, it was 2013 when I (re)discovered my passion for web programming.
| Tag | Count |
|---|---|
| Windows Phone | 13 |
| Web | 12 |
| Dev | 11 |
Top 3 Tags 2014
Newport, my personal Windows Phone MVVM framework, makes its first appearances.
| Tag | Count |
|---|---|
| Windows Phone | 16 |
| Programming | 16 |
| Newport | 6 |
Top 3 Tags 2015
First time, general musings ranked in the top posts.
| Tag | Count |
|---|---|
| Windows Phone | 5 |
| Musings | 5 |
| Web | 5 |
Top 3 Tags 2016
Making and tinkering with electronics was the focus of most posts in this year.
| Tag | Count |
|---|---|
| Make | 6 |
| DIY | 6 |
| Arduino | 3 |
Top 3 Tags 2017
The trend continues.
| Tag | Count |
|---|---|
| Make | 9 |
| Electronics | 8 |
| Fun | 6 |
Top 3 Tags 2018
I had been down the rabbit hole of 3D Printing for quite a while already, but in that year I dedicated most of my blog posts to this topic.
| Tag | Count |
|---|---|
| 3DPrinting | 5 |
| Make | 5 |
| DIY | 5 |
Top 3 Tags 2019
2019 was a tie between Web and DIY topics.
| Tag | Count |
|---|---|
| Web | 6 |
| DIY | 6 |
| make | 6 |
Top 3 Tags 2020
Finally, the RaspberryPi made its way to the top. I have a fan of this device and its ecosystem from the first hour.
| Tag | Count |
|---|---|
| RaspberryPi | 4 |
| DIY | 4 |
| Make | 4 |
Journeys
Looking back at all these blog posts is also quite fascinating from a personal perspective, it's like taking a step back and seeing (an aspect of) yourself developing in time lapse.
There are a few obvious journeys and transitions, where I developed new interests and hobbies or grew bored of technologies and adopted news ones.
I transitioned from having a hosted blog, over hosting it myself using Orchard CMS to running my self-created blog/website. I even wrote quite a detailed post about this transition.
The Windows to Linux journey: I was an avid Windows fan back in the days, but buying my first RaspberryPi slowly but steadily sucked me into the Linux universe. Today, there is just a single Windows device left in my house, which is the company laptop. Quite a journey for someone who once wrote blog posts like this.
I already mentioned my passion for Windows Phone a couple of times in this retrospective. This is yet another interesting journey, where I can see my frustration growing in time lapse until I became the happy iPhone user I am today.
Another interesting turning point for me was the time when I discovered my passion for making and electronics. October 2015 marks the first time when a post featuring these tags made its appearance.
In a nutshell
Recently, I discovered canva.com, an online tools for creating all kinds of designs and artworks. This is my first attempt of creating an infographic.