OpenTelemetry. NET in Blazor WebAssembly
March 6, 2021OpenTelemetry and Blazor are technologies that I have been following closely over the last months and years. The first one professionally, the second one mostly out of personal interest.

Since the promise of Blazor is to run arbitrary .NET code in the browser, I figured why not give this a try and take OpenTelemetry .NET for a spin in a Blazor WebAssembly app. Admittedly, this is a bit of an unusual operation scenario for OpenTelemetry. NET, which is mainly designed for server apps. But running it inside a browser as a WebAssembly application is at least an interesting challenge.
Create the Blazor Application
Even on Linux, this has come down to these command-line statements.
mkdir OTelBlazor
cd OTelBlazor
dotnet new blazorwasm
dotnet run
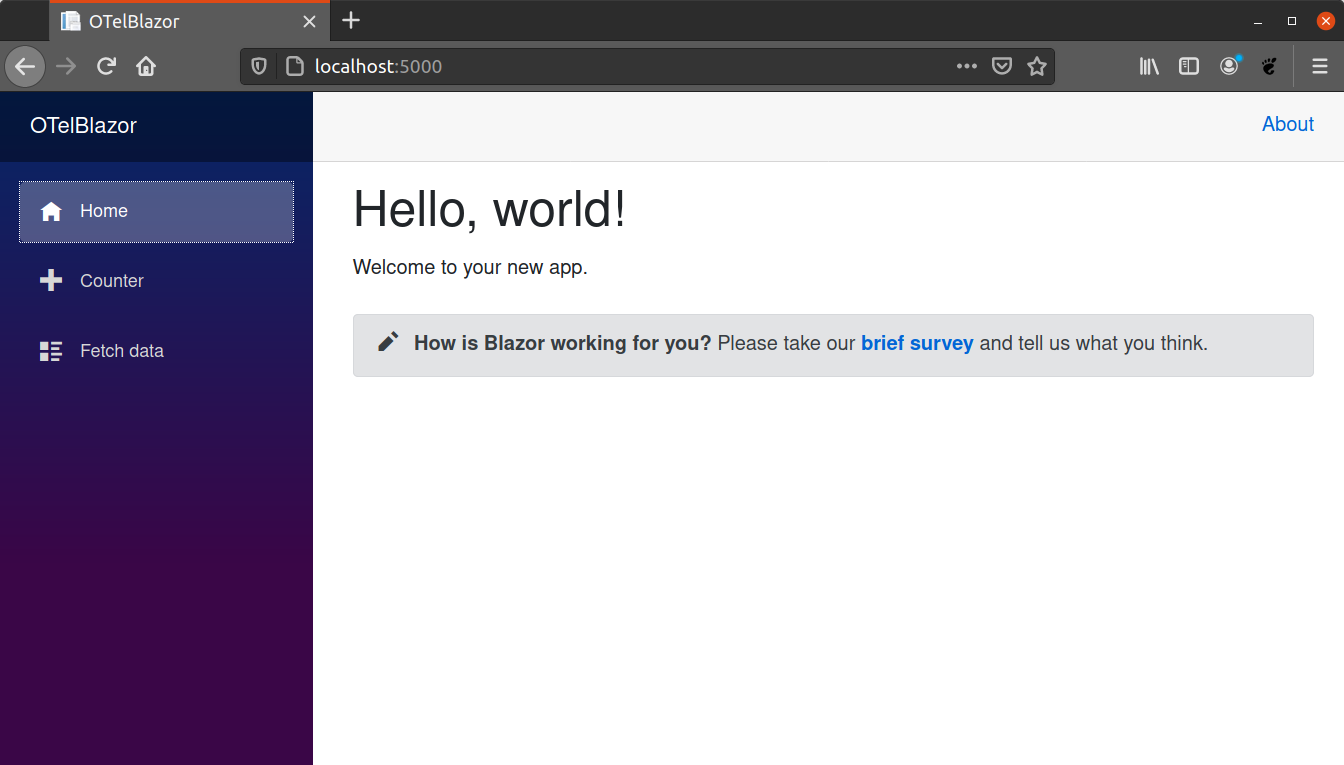
Open https://localhost:5001 in your browser and a Blazor WebAssembly application is ready to be tried out.
Start a Tracing Backend
For collecting and visualizing the traces generated with OpenTelemetry and our Blazor application we will use Jaeger, because it:
- is free, and open-source
- runs on Windows, Mac and Linux
- supports a range of input protocols and formats for trace data.
So, let's:
- download Jager here
- run
./jaeger-all-in-one - open it in a browser at
http://localhost:16686
But before we can see any traces in the Jaeger UI we actually have to add OpenTelemetry to the Blazor application.
Add OpenTelemetry .NET
First, we need to pull in a few NuGet packages for OpenTelemetry.
dotnet add package OpenTelemetry --version 1.0.1
dotnet add package OpenTelemetry.Api --version 1.0.1
dotnet add package OpenTelemetry.OpenTelemetry.Exporter.Zipkin --version 1.0.1
Note: at the time of writing this blog post the version
1.0.1was the latest release of OpenTelemetry .NET.
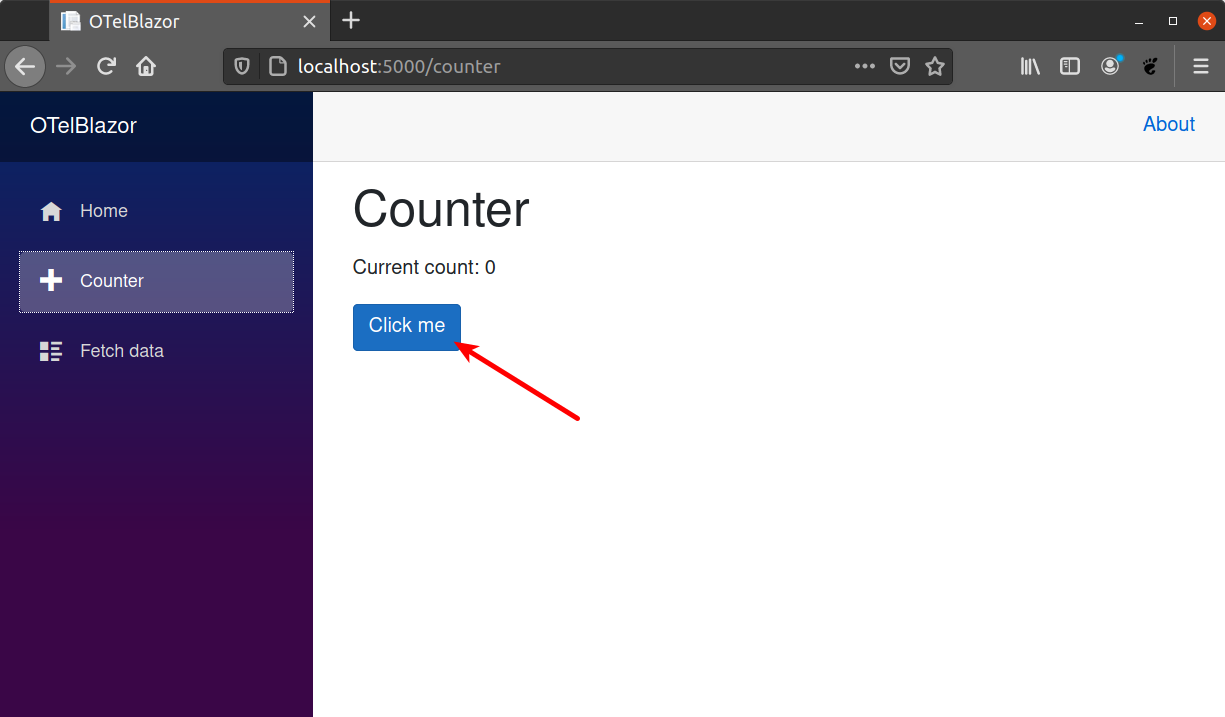
With these packages pulled in, let's extend the Counter.razor page with tracing instructions
so that each time, the clicks the Click me button, a trace will be generated and
sent to Jaeger.
This is the code for Counter.razor page:
@page "/counter"

<h1>Counter</h1>

<p>Current count: @currentCount</p>

<button class="btn btn-primary" @onclick="IncrementCount">Click me</button>

@using OpenTelemetry;
@using OpenTelemetry.Resources
@using OpenTelemetry.Trace
@using System.Diagnostics

@code {
    private int currentCount = 0;

    private void IncrementCount()
    {
        Trace(currentCount++);
    }

    private void Trace(int currentCount)
    {
      using var openTelemetry = Sdk.CreateTracerProviderBuilder()
              .SetResourceBuilder(ResourceBuilder.CreateDefault().AddService("blazor-otel"))
              .AddSource("BlazorUI")
              .AddZipkinExporter(o =>
              {
                  o.Endpoint = new Uri("http://localhost:9411/api/v2/spans");
                  o.ExportProcessorType = ExportProcessorType.Simple;
              })
              .Build();
      using var source = new ActivitySource("BlazorUI");
      using (var activity = source.StartActivity("Click", ActivityKind.Client))
      {
          activity?.AddEvent(new ActivityEvent("The count button was clicked"));

          activity?.SetTag("count", currentCount);
          activity?.SetTag("mouse.x", 123);
          activity?.SetTag("mouse.y", 2323);
      }
    }
}
A few things are important here:
- We call
AddZipkinExporterwhich - as the name suggests - exports the traces via the Zipkin protocol. This seems strange at first, because Zipkin is actually a different tracing backend, but:- the Jaeger Exporter for OpenTelemetry .NET only uses UDP at the moment which does not work in Blazor / WebAssembly applications.
- Jaeger also supports the Zipkin protocol, so this exporter is an obvious choice.
- We specifically set
ExportProcessorType.Simplebecause the default isExportProcessorType.Batchwhich makes use of the .NETThreadingAPI, which again is not available to Blazor apps. - The rest is mostly default OpenTelemetry .NET tracing code which produces a
- service called
blazor-otel - span (
Activity) with the nameBlazorUIthat has- an event (visualized later as log by Jaeger)
- some attributes (here: Tags) which we will see later in Jaeger.
- service called
When running the Blazor application and pushing the Click me button we will face our first disappointment and see the following error log message in the browser console.
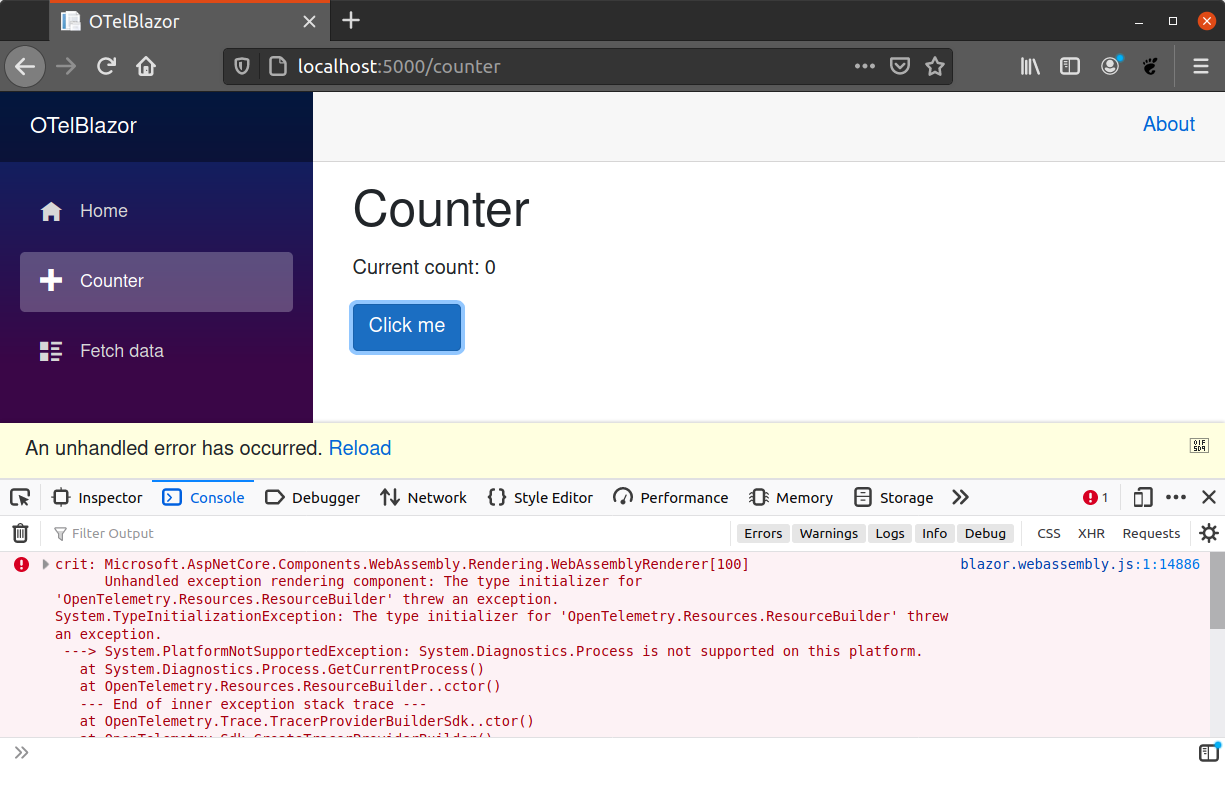
Apparently the usage of the class System.Diagnostics.Process is the culprit since this
is not available to Blazor Apps.
Microsoft.AspNetCore.Components.WebAssembly.Rendering.WebAssemblyRenderer[100]
      Unhandled exception rendering component: The type initializer for 'OpenTelemetry.Resources.ResourceBuilder' threw an exception.
System.TypeInitializationException: The type initializer for 'OpenTelemetry.Resources.ResourceBuilder' threw an exception.
 ---> System.PlatformNotSupportedException: System.Diagnostics.Process is not supported on this platform.
   at System.Diagnostics.Process.GetCurrentProcess()
   at OpenTelemetry.Resources.ResourceBuilder..cctor() in /home/z1c0/dev/otel/opentelemetry-dotnet/src/OpenTelemetry/Resources/ResourceBuilder.cs:line 33
   --- End of inner exception stack trace ---
   at OpenTelemetry.Trace.TracerProviderBuilderSdk..ctor() in /home/z1c0/dev/otel/opentelemetry-dotnet/src/OpenTelemetry/Trace/TracerProviderBuilderSdk.cs:line 34
   at OpenTelemetry.Sdk.CreateTracerProviderBuilder() in /home/z1c0/dev/otel/opentelemetry-dotnet/src/OpenTelemetry/Sdk.cs:line 63
   at OTelBlazor.Pages.Counter.Trace(Int32 currentCount) in /home/z1c0/dev/OTelBlazor/Pages/Counter.razor:line 25
   at OTelBlazor.Pages.Counter.IncrementCount() in /home/z1c0/dev/OTelBlazor/Pages/Counter.razor:line 19
...
This is unfortunate, but let's be pragmatic here and make ...
A few Adaptions
Let's clone the OpenTelemetry .NET GitHub repository and fix this.
git clone https://github.com/open-telemetry/opentelemetry-dotnet.git
Open the file ResourceBuilder.cs and change the property DefaultResource like this,
so that the System.Diagnostics.Process code is commented out.
private static Resource DefaultResource { get; } = new Resource(new Dictionary<string, object>
{
  [ResourceSemanticConventions.AttributeServiceName] = "unknown_service"
    //+ (string.IsNullOrWhiteSpace(System.Diagnostics.Process.GetCurrentProcess().ProcessName)
    //? string.Empty :
    //":" + System.Diagnostics.Process.GetCurrentProcess().ProcessName),
});
To save you time: there's another class (ResourceBuilderExtensions) using a Blazor-unsupported API.
Let's change this as well, namely the property TelemetryResource where we need to comment
usage of FileVersionInfo.
  //private static readonly string FileVersion = FileVersionInfo.GetVersionInfo(typeof(Resource).Assembly.Location).FileVersion;

  private static Resource TelemetryResource { get; } = new Resource(new Dictionary<string, object>
  {
    [ResourceSemanticConventions.AttributeTelemetrySdkName] = "opentelemetry",
    [ResourceSemanticConventions.AttributeTelemetrySdkLanguage] = "dotnet",
    //[ResourceSemanticConventions.AttributeTelemetrySdkVersion] = FileVersion,
  });
These (admittedly hacky) changes neither affect the build nor the functionality of our sample. So let's rebuild and the only thing left to do is making use of our custom OpenTelemetry .NET assemblies now instead of the NuGet packages.
The OTelBlazor.csproj should now look similar to this, depending on the path to your locally build assemblies.
<Project Sdk="Microsoft.NET.Sdk.BlazorWebAssembly">

  <PropertyGroup>
    <TargetFramework>net5.0</TargetFramework>
  </PropertyGroup>

  <ItemGroup>
    <PackageReference Include="Microsoft.AspNetCore.Components.WebAssembly" Version="5.0.3" />
    <PackageReference Include="Microsoft.AspNetCore.Components.WebAssembly.DevServer" Version="5.0.3" PrivateAssets="all" />
    <PackageReference Include="System.Net.Http.Json" Version="5.0.0" />
  </ItemGroup>

  <ItemGroup>
    <Reference Include="OpenTelemetry">
      <HintPath>/REPLACE_WITH_YOUR_PATH/OpenTelemetry.dll</HintPath>
    </Reference>
    <Reference Include="OpenTelemetry.Api">
      <HintPath>/REPLACE_WITH_YOUR_PATH/OpenTelemetry.Api.dll</HintPath>
    </Reference>
    <Reference Include="OpenTelemetry.Exporter.Zipkin">
      <HintPath>/REPLACE_WITH_YOUR_PATH/OpenTelemetry.Exporter.Zipkin.dll</HintPath>
    </Reference>
  </ItemGroup>
</Project>
Almost there
Since these basic impediments are cleared, now is a good time to launch Jaeger, with the Zipkin endpoint enabled (this is not on by default). Also, we add a few arguments to prevent problems with CORS that would otherwise prevent us from exporting trace data.
./jaeger-all-in-one \
  --collector.zipkin.host-port=localhost:9411 \
  --collector.zipkin.allowed-origins="*" \
  --collector.zipkin.allowed-headers="*"
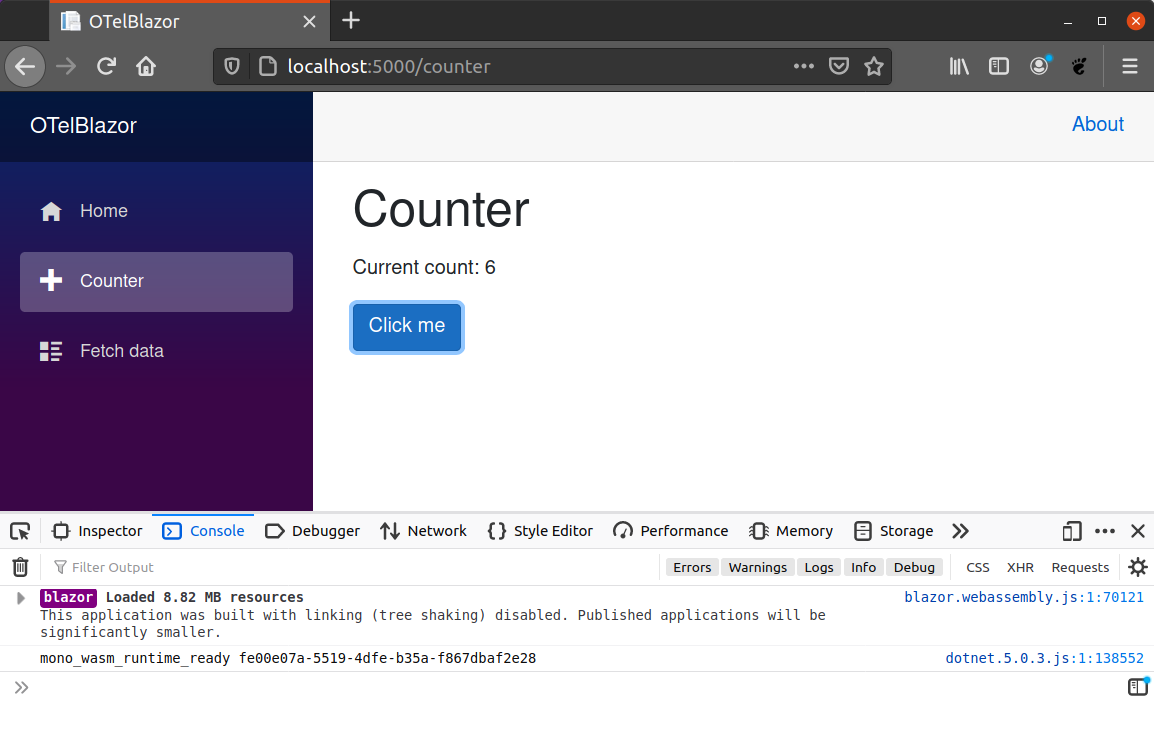
Pushing the Click me button in the Blazor app now should not trigger any more error messages. Keep a close watch on the log window.
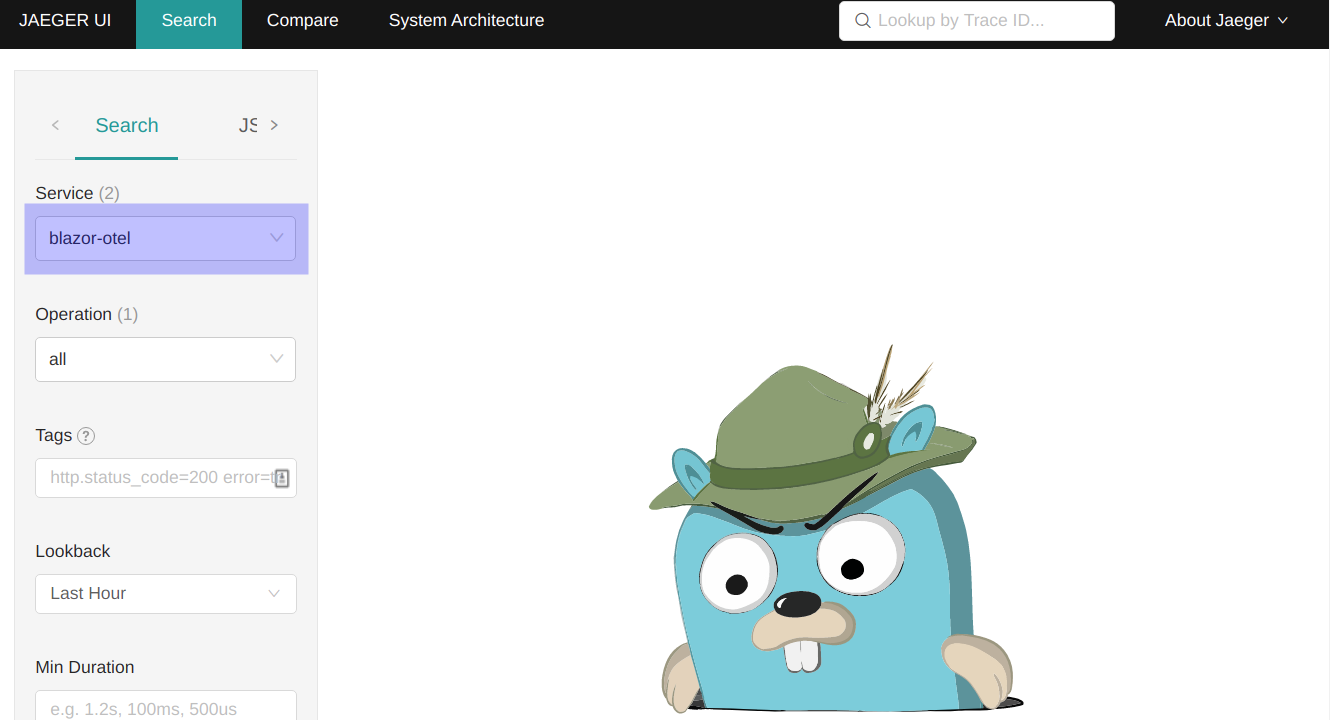
So, let's move over to Jaeger and - lo and behold - a service named otel-blazor
appears in the dropdown.
If we take a look at the traces associated with this service, we immediately recognize the data generated by our button click.
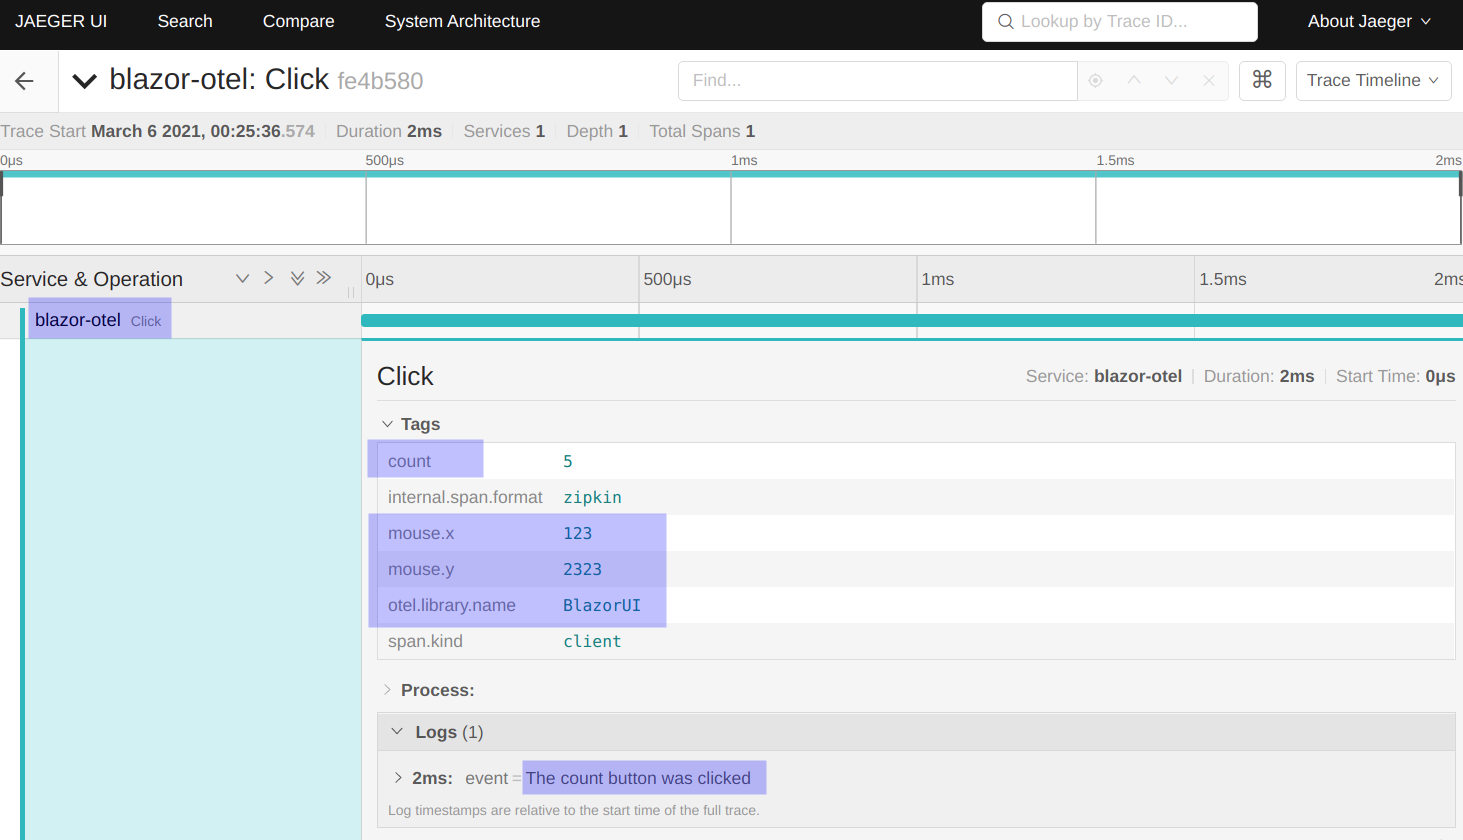
Nice! But is this useful?

Well, at least it was an interesting challenge and experiment, but I'm sure there is a lot of untapped potential here when it comes to real user monitoring and connecting user interactions on Blazor pages with transactions in services and the backend.
I will probably raise some GitHub issues for file PRs for the issues I had to workaround now and then we will see if this triggers discussion and thoughts towards Blazor, WebAssembly and OpenTelemetry.
Note: The full Blazor sample (with the adapted OpenTelemetry .NET assemblies) is available here on GitHub.